Oman Water Demand Forecasting
Daily 28 · Weekly 11 · Weekly 4
A review pack you can run yourself. Two bottle sizes, five main sales regions, one small model per region, plain-English method, honest numbers, the exact settings we used.
Accuracy = 100 × (1 − WAPE). Every number in this report comes from a real out-of-sample holdout, not from training data. DUQM and PDO are forecast but excluded from the headline score — Chapter 9 explains why, with numbers.
1The question we were asked
A water bottler in Oman sells two products — 24×330ML packs and 30×200ML packs — across 12 sales areas grouped into 7 regions. The factory, the trucks, and the warehouses all need to know how much water will be sold next, and where. We were asked two things:
- Daily: predict sales for each area for the next 28 days. Trucks load every morning. Target customers: distribution and drivers.
- Weekly: predict sales for each region for the coming weeks. Production runs, raw water, bottles, and warehouse space are planned weekly. Target customers: plant and supply chain.
2The data we were given
| Product | Rows | Areas | Regions | History |
|---|---|---|---|---|
| 24 × 330ML packs | 12,568 | 12 | 7 | 1 Jan 2021 → 24 Jan 2025 |
| 30 × 200ML packs | 14,583 | 11 | 7 | 1 Jan 2021 → 29 Jan 2025 |
Each row is one day, one area, one product: the day, the area, the region, and the cases sold. Four things about this file shaped every decision that followed.
2.1 There is not a single zero in the file
Across more than 27,000 rows, the smallest sale is 1 case. The source system only writes a row when something was sold. So a missing day usually means no sale happened — not that the data was lost. That single observation drives the filling policy in Chapter 3.
2.2 Some days are missing everywhere at once
20–23 July 2021 (Eid al-Adha) is missing in almost every area. 3 October 2021 (Cyclone Shaheen emergency holiday) is missing in several. Those are real closures, and the pattern repeats across both products — strong evidence they are genuine no-sale days, not broken records.
2.3 Friday means something different in every area
| Area | Fridays in history | Fridays with no sale | Share |
|---|---|---|---|
| IBRA | 211 | 197 | 93% |
| IBRI | 211 | 158 | 75% |
| SUR | 212 | 79 | 37% |
| NIZWA | 212 | 72 | 34% |
| SAHAM | 213 | 32 | 15% |
| AMERAT | 213 | 1 | 0.5% |
In IBRA, Friday is effectively a closed day. In AMERAT, Friday is a normal selling day. No single "Friday = zero" rule can be true for both. The model has to learn area × weekday, which is exactly what the features in Chapter 4 allow it to do.
2.4 One stretch of October 2021 looks like a data outage, not a holiday
11–15 October 2021: many normally busy 330ML areas (AMERAT, RUSAYL, MUSANNAH, SALALAH, SAHAM) go silent at the same time, while 200ML keeps selling. There is no public holiday in that window. Seventeen values are affected — a tiny number — and they are handled separately from real zero days (Chapter 3), with the assumption flagged in the data.
3How missing days were filled (the policy)
One rule for every blank would be wrong. A blank can mean "nobody ordered that day" (truly zero) or "the system lost that day" (unknown, not zero). Those two need opposite treatment. The policy below sorts every blank into one of four buckets.
| Situation | What we write into the data | Audit flag |
|---|---|---|
| Real sale (row exists in the source) | Volume as-is, never touched | was_observed = 1 |
| Known shared closure (Eid, cyclone) | Volume = 0 | is_closure = 1 |
| 330ML Oct 11–15 2021 outage (17 values) | Median of the same weekday ±4 weeks | is_imputed = 1, weight 0.25 |
| Any other blank inside an area's active span | Volume = 0 (likely no-sale day) | imputation_method = zero_no_sale |
| Before the first sale / after the last sale | No row created | inactive period, not a zero |
The 330ML outage estimate, worked out
Take AMERAT on Monday 11 October 2021. The surrounding Mondays in the source file sold 716, 854, 833, 1732, 690, 912, 837, 653 cases. The median is 835. That 835 is written in, marked as an estimate, and given only a quarter of the training weight of a real row. Seventeen values were filled this exact way.
| Product | Total rows | Real sales | No-sale zeros | Closure zeros | Estimated |
|---|---|---|---|---|---|
| 200ML | 16,378 | 14,583 | 1,750 | 45 | 0 |
| 330ML | 17,697 | 12,568 | 5,062 | 50 | 17 |
That is 93% real data in the 200ML file and 71% in the 330ML file. The 330ML file is sparser because four of its areas sell very little (Chapter 9).
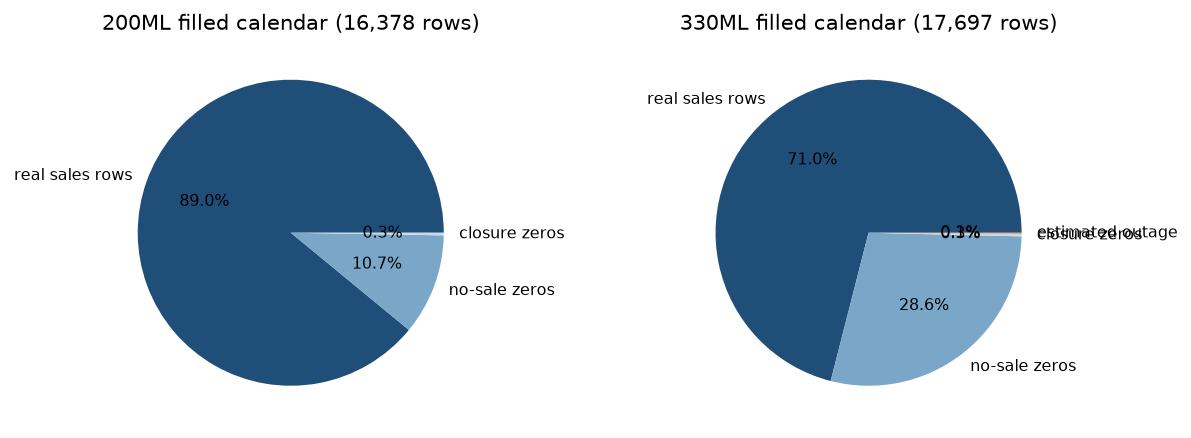
is_imputed = 0). A guess can help training; a guess is never counted as truth when
measuring accuracy.4How one forecast is made
The model is a small decision-tree ensemble called LightGBM, the same family of method that won the M5 retail forecasting competition. It is not a neural network and not deep learning. We train one model per region per product — ten small models in total in this pack — because each region has its own habits.
4.1 The rule that keeps the score honest
All history features are built with a one-day shift — when the model predicts Tuesday, it is allowed to see Monday and earlier, never Tuesday itself. And the last 28 days of history are held out completely: the model never trains on them. The score in this report is only ever measured on those unseen days.
4.2 What "accuracy" means here (WAPE, in one minute)
We measure error with WAPE — the total absolute miss divided by the total actual volume.
Actual week:    1,000 cases
Forecast:         950 cases
Miss:              50 cases
WAPE  = 50 / 1000 = 5%      Accuracy = 100% − 5% = 95%
WAPE is a percentage of the whole, so it does not punish big regions and small regions equally per case — it asks "of all the water we shipped, how much did we misjudge?" That matches how the business thinks about a plan.
4.3 The exact settings used (winners only)
Each region's best settings are stored in params/best_params_200ML.json and
params/best_params_330ML.json so the reviewer runs exactly what produced these numbers.
| Product / region | Model | Learning rate | Leaves | Tweedie power |
|---|---|---|---|---|
| 200ML CAPITAL, Batinah, Sharqiyah | Tweedie | 0.05 – 0.11 | 511 | 1.05 – 1.18 |
| 200ML Dhofar, Al Dakhiliyah | Tweedie | 0.03 – 0.07 | 127 – 511 | 1.14 – 1.49 |
| 330ML CAPITAL | Poisson | 0.10 | 63 | — |
| 330ML Batinah, Dhofar, Sharqiyah, Al Dakhiliyah | Tweedie | 0.02 – 0.11 | 127 – 511 | 1.29 – 1.53 |
Tweedie and Poisson are count-friendly objectives: they suit demand data with many small days and occasional big ones, and cannot predict negative cases. The model stops training automatically when the last 28 days of training stop improving (early stopping).
5Daily results and the daily ceiling
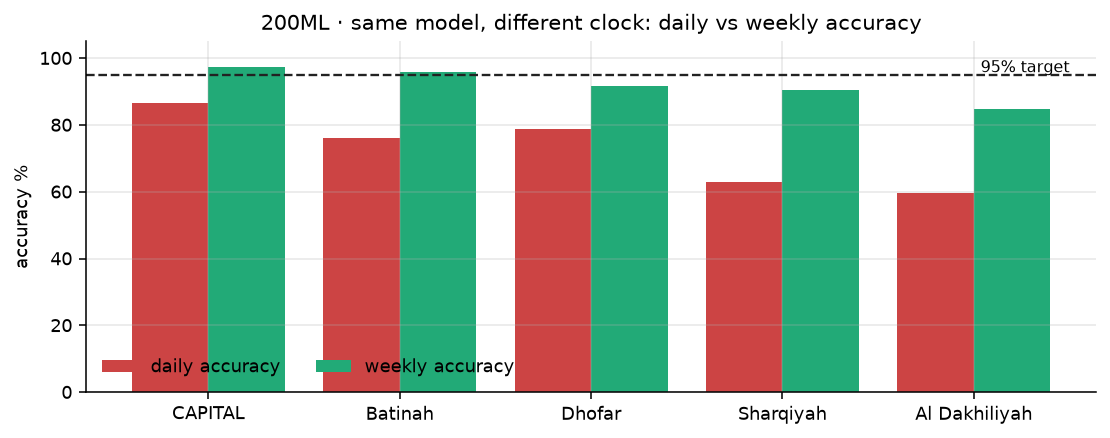
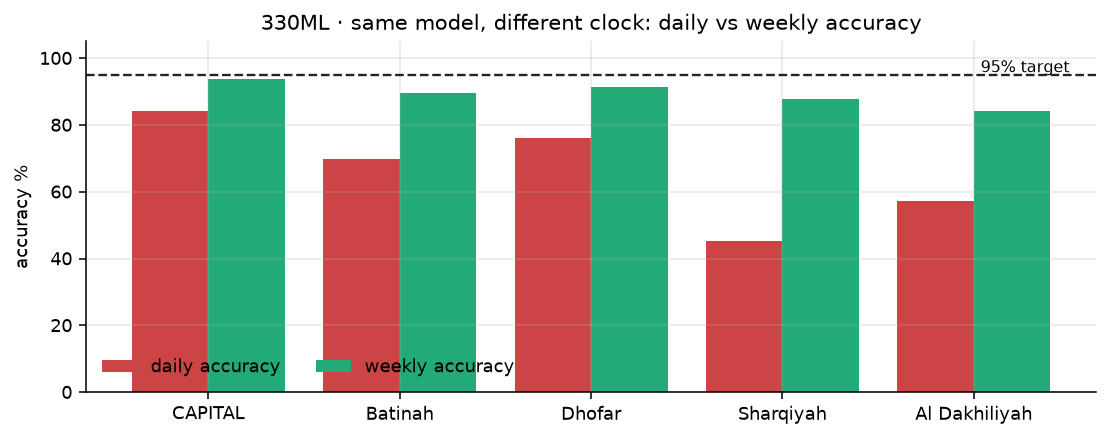
Daily accuracy for the next 28 days, measured on unseen days, five regions:
| Region | 200ML | 330ML |
|---|---|---|
| CAPITAL | 86.6% | 84.2% |
| Dhofar | 78.8% | 76.1% |
| Batinah | 76.2% | 69.9% |
| Sharqiyah | 63.0% | 45.4% |
| Al Dakhiliyah | 59.6% | 57.1% |
| All five together | 78.9% | 77.4% |


5.1 Where the daily error comes from
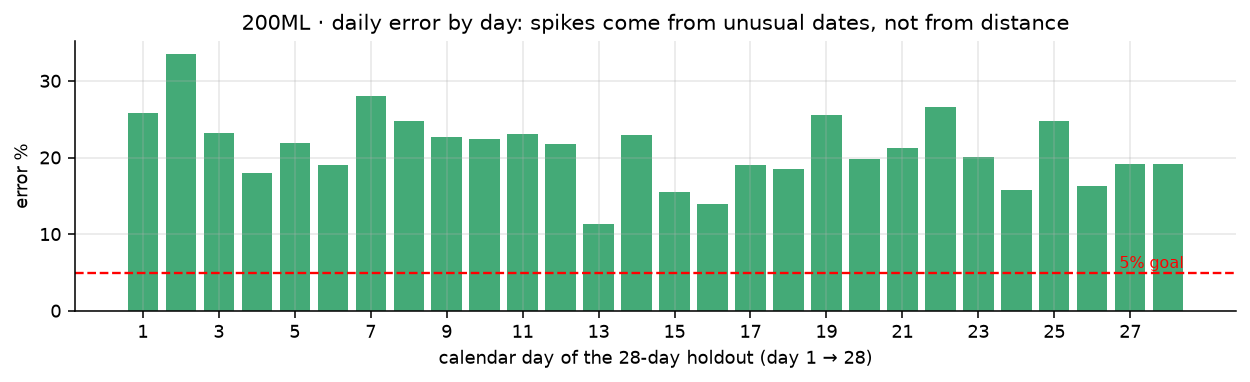
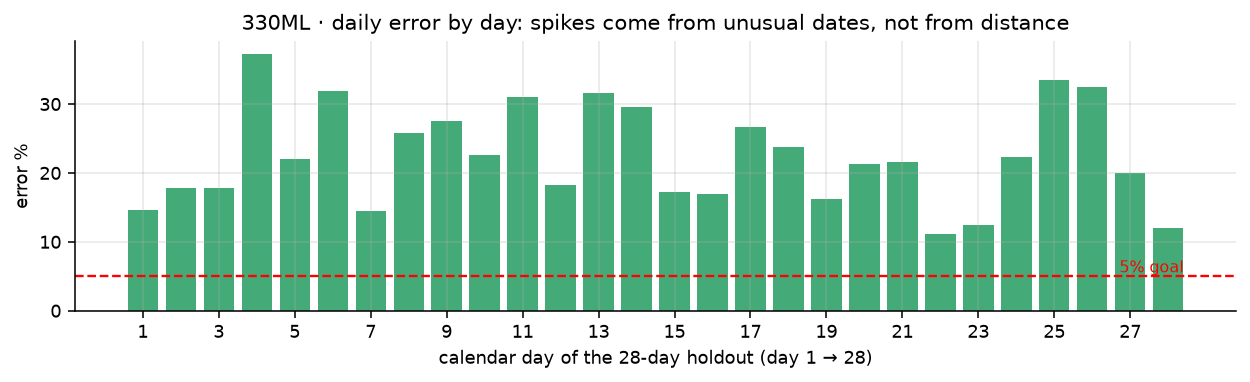
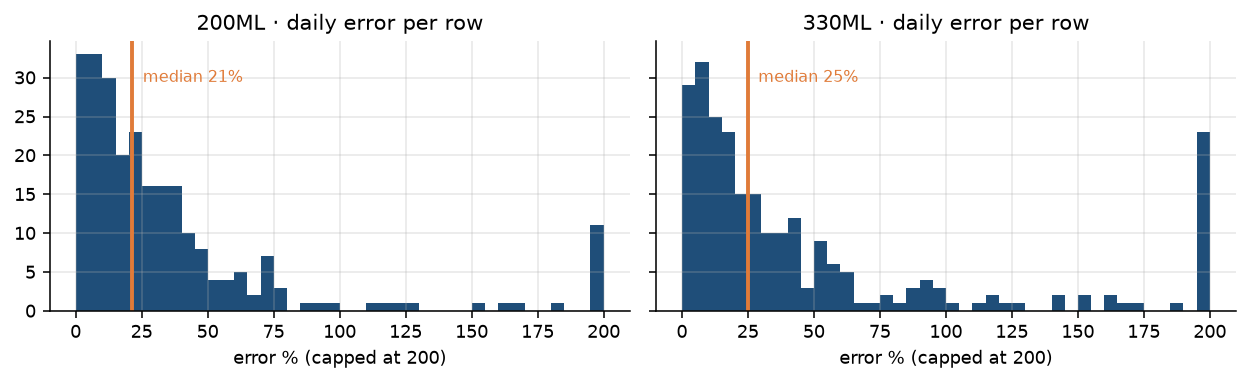
- A single day is one lumpy decision. A shop that orders 0 on Monday and 500 on Tuesday makes the day-to-day line jump. History cannot know which Tuesday the truck arrives; the model splits the difference and takes the error.
- Friday has five different meanings. Closed in IBRA, normal in AMERAT. The model learns this, but any single surprise Friday is a large miss on a single day.
- Holidays stop trucks, not thirst. Eid and cyclone days are zero sales but not zero demand. And nothing in the file explains the biggest jumps — no promotions, no price, no stock-out records, no delivery routes.
- Small denominators explode percentages. Missing 30 cases in an area that sells 60 that day is a 50% error for that row, even though the business barely notices 30 cases.
- Four years is a short teacher. Ramadan drifts about 11 days every year, so each area's Ramadan pattern has been seen only four times. That is thin evidence for such a strong event.
6Weekly results
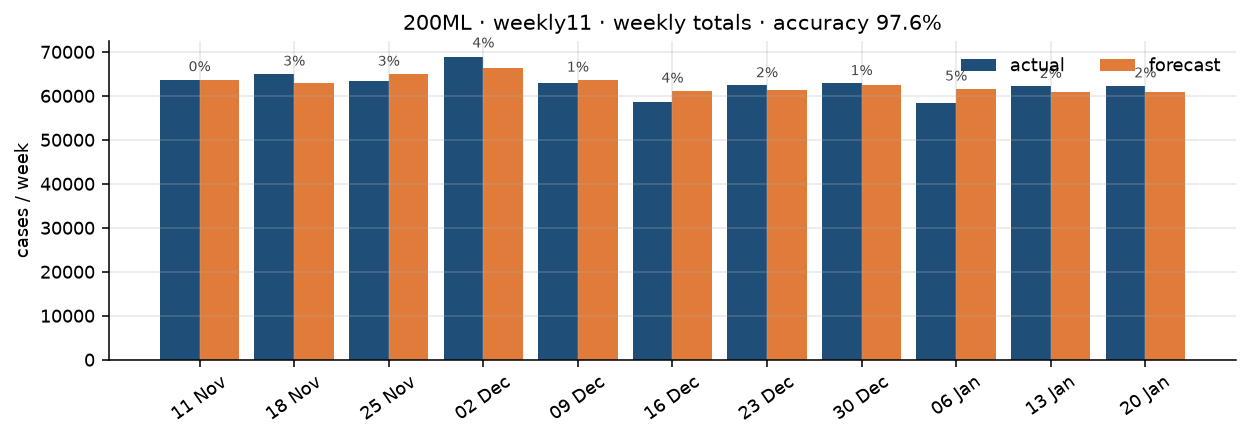
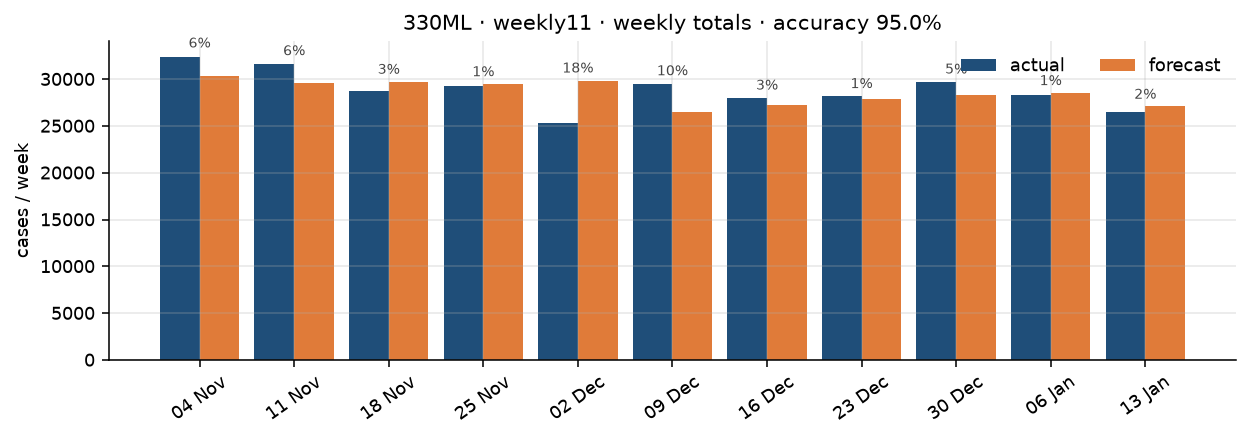
The same ten models, the same forecasts — simply added up over Monday-to-Sunday weeks before scoring. Two horizons were tested: the last 11 full weeks, and the last 4 weeks.
6.1 Eleven weeks
| Region | 200ML | 330ML |
|---|---|---|
| CAPITAL | 97.3% | 93.9% |
| Batinah | 95.7% | 89.6% |
| Dhofar | 91.5% | 91.3% |
| Sharqiyah | 90.5% | 87.8% |
| Al Dakhiliyah | 84.7% | 84.0% |
| All five together | 97.6% | 95.0% |
6.2 The last four weeks
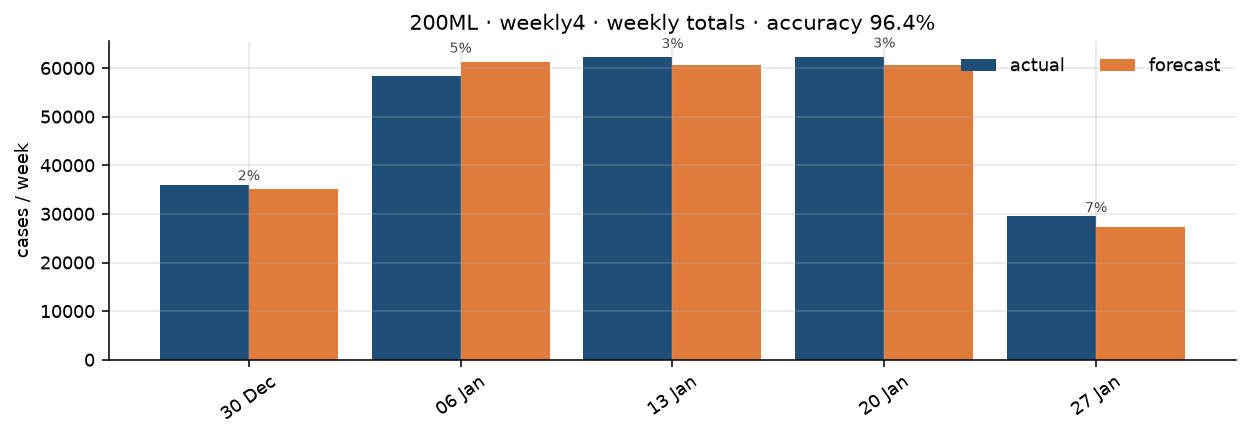
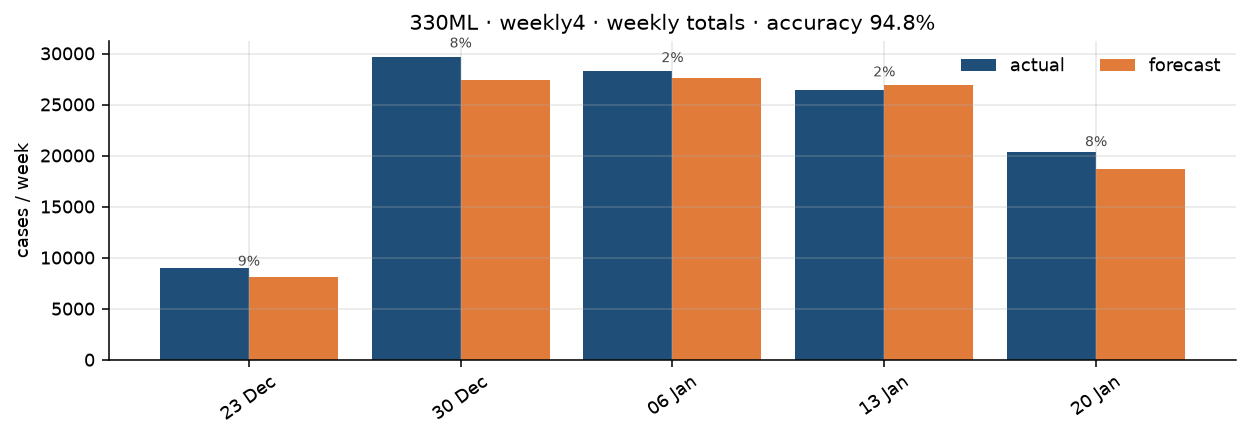
Same models, retrained on history ending four weeks ago — a check that the accuracy is not a lucky artifact of one long window.
| Region | 200ML | 330ML |
|---|---|---|
| CAPITAL | 97.0% | 92.8% |
| Batinah | 94.2% | 89.2% |
| Dhofar | 92.5% | 88.7% |
| Sharqiyah | 90.8% | 88.4% |
| Al Dakhiliyah | 82.7% | 92.0% |
| All five together | 96.4% | 94.8% |
7Why weekly beats daily
This is the single most important idea in the pack, and it is not a model trick — it is arithmetic.
Over a week, a slow Monday is usually paid back by a busy Tuesday. Adding the days together before comparing means the random part of the wobble cancels while the real level remains. The model was never bad at the level of demand — it was bad at guessing the exact day. The weekly number uses what the model is actually good at.
8What each forecast is for (business)
| Decision | Clock to use | Who uses it | Why that clock |
|---|---|---|---|
| How much to produce next week (raw water, bottles, line time) | Weekly | Plant, production planning | Runs are batched weekly; a day-level miss is irrelevant to a weekly run. 95–98% is enough to plan materials and shifts. |
| Warehouse space and stock transfer between regions | Weekly | Supply chain | Replenishment lead times are measured in weeks; weekly totals set safety stock. |
| Truck capacity and fleet allocation per region | Weekly | Logistics planning | Fleet size is re-planned weekly, not daily. |
| Which shops and areas each truck serves tomorrow | Daily | Distribution, drivers | A driver needs a number per area per day to load the right quantity; 78% daily accuracy is the honest guidance range, not a promise per shop. |
| Short shelf-life urgent replenishment | Daily | Area supervisors | Daily view shows the next few days; supervisors adjust with local knowledge. |
9Why DUQM and PDO sit outside the headline
DUQM, DUQUM PDO and PDO are real customers, and the models do forecast them. They are left out of the headline accuracy for one reason: their history is too thin to measure with a percentage fairness.
| Area | Product | Days with sales | Active days | Coverage |
|---|---|---|---|---|
| PDO | 200ML | 150 | 1,480 | 10% |
| DUQM | 330ML | 362 | 1,427 | 25% |
| DUQUM PDO | 330ML | 86 | 1,445 | 6% |
When a region sells in only a handful of days, a weekly percentage error is divided by a tiny number. Predicting 40 cases in a week when the truth is 10 is reported as a 300% error — a scary number for a 30-case miss. Their absolute misses are small: 200ML PDO's typical daily miss is about 3 cases. That is why the pack reports them separately, with the honest note that a percentage cannot describe them well.
| Headline | 200ML | 330ML |
|---|---|---|
| Weekly 11-week accuracy, five main regions | 97.6% | 95.0% |
| Same, with DUQM and PDO added back | 97.6% | 93.5% |
200ML barely moves because DUQM and PDO sell almost nothing there. 330ML drops 1.5 points because two sparse sites with wild percentages are enough to pull the average down. Nothing about the other five regions changed.
10Reproduce everything yourself
CPU only. No API keys, no internet, no special hardware. From this folder:
pip install -r requirements.txt
python3 daily28/train.py  && python3 daily28/predict.py    # daily 28-day holdout
python3 weekly11/train.py && python3 weekly11/predict.py  # 11-week window
python3 weekly4/train.py  && python3 weekly4/predict.py   # last 4 weeks
python3 make_charts.py                                      # rebuild every chart
| Path | What it is |
|---|---|
data/*_daily_calendar_filled.csv | The filled calendars with every flag intact (was_observed, is_imputed, training_weight) |
params/best_params_*.json | The exact settings that produced the numbers in this report |
daily28/, weekly11/, weekly4/ | train + predict scripts, saved models |
predictions/ | Row-level actual-vs-forecast CSVs you can audit or chart |
charts/ | Every figure in this report, regenerated from the predictions |
11Glossary and straight answers
| Term | Meaning in this pack |
|---|---|
| WAPE | Total absolute error ÷ total actual volume. So "5% WAPE" means "we misjudged 5% of the water shipped". |
| Accuracy | 100% − WAPE. Used everywhere in this report. |
| Holdout | The last days of history, removed from training, used only to score. |
| Lag | Sales from N days ago, e.g. lag_7 = the same weekday last week. |
| Rolling mean | The average of the previous N days — a smooth memory of recent level. |
| Tweedie / Poisson | Objective functions for count data (cases sold). They fit demand with many small days and occasional large ones and can never predict negative sales. |
| LightGBM | A decision-tree ensemble; the same family that won the M5 retail forecasting competition. |
| Early stopping | The model keeps a small internal check window and stops improving when it starts to memorize. |
Straight answers
Why not deep learning? Four years of daily data across a handful of areas is small. Tree ensembles have repeatedly matched or beaten neural networks on this kind of tabular, intermittent demand — including in the M5 competition this project takes its recipe from. Neural networks would add complexity without evidence of gain.
Can daily accuracy ever reach 95%? Not with this data. To get there the model would need to know the events that actually move a single day: promotions and prices, out-of-stock days, delivery schedules, and a confirmed closure calendar. With those inputs a daily model could improve; without them it is guessing at the noisiest part of the signal. Weekly already crosses 95% for four of five regions without any of that.
Does weather help? It was tested properly (temperature, humidity, rain, heat flags from ERA5 reanalysis). It produced no measurable lift on either product, so it was left out to keep the models simple. It can be revisited when more history exists.
What should we do next? Two things pay first: get the promotion and stock-out history from the business to attack the daily error where it is largest, and keep the weekly forecast as the production number, since weekly accuracy is already at the level the plant needs.